INTRODUCTION Given the increasing demand for environmental protection and the increasing severity of water pollution, the state has set standards for the content of multiple water pollutants. There are two main types of water quality parameters that are widely used: one is the direct reflection of specific components in water, such as the concentration of metal ions; the other is called alternative parameters such as COD, BOD, TOC, and so on. Substitution parameters can easily and quickly reflect the physical, chemical and microbiological characteristics of water.
Many domestic and foreign scientific research institutions and professional manufacturers are studying how to determine these water quality substitution parameters online. At present, the main technical principles of the online automatic analyzer include chemical titration, electrochemical measurement, visible and ultraviolet spectrophotometry. The principle of the first method is to determine the content of water quality parameters by chemical titration. The disadvantages are long measurement time, complicated operation and maintenance, high operating costs, and secondary pollution.
The principle of the second method is to use the organic substance in water to be oxidized on the surface of the working electrode. At the same time, the working electrode will have a current change. When the potential balance of the working electrode, the current change has a linear relationship with the water quality parameter. Water quality parameters can be measured by calculating current changes. Its main features are fast measurement, simple instrument structure and no secondary pollution. The disadvantage is that there is a linear relationship between the electrode current changes produced by different electrochemical methods and one alternative parameter, and there is a nonlinear relationship with other water quality parameters. Therefore, an on-line analyzer, which is generally based on the electrochemical method, can only measure one water quality parameter. The third method is a method based on the absorption law to quantitatively analyze the degree of absorption of the characteristic electromagnetic radiation by molecules or ions of the measured substance.
Experiments have shown that UV absorbance can reflect the degree of organic pollution in water, especially for a large class of aromatic organic compounds in the water and is particularly sensitive to organic compounds with double bonds. Many data also show that the UV absorbance has a certain correlation with some major water quality surrogate parameters [4]. Therefore, it is of great theoretical and practical significance to obtain water quality parameters by analyzing UV absorbance. The article introduces a new type of online UV spectrometer water quality analyzer. Using ultraviolet spectrophotometry as the principle, it collects the full waveband spectrum of the water sample in the ultraviolet region. By analyzing the correlation of the spectral data, the characteristic spectrum in the full spectrum is obtained. Then, the algorithm of intelligent software was used to analyze the relationship between the spectrum and various water quality parameters, and a related prediction model was established. The experimental results show that the water quality analyzer has the characteristics of fast measurement speed, high precision, good tracking performance, and easy operation, and it has great advantages compared with similar products.
1. System Measurement Principle This instrument is a water quality analyzer based on ultraviolet spectrophotometry. Different from the analyzer with the same principle in foreign countries, the light source used by foreign instruments only produces a single-wavelength spectrum. This is because UV UV254 is approximately linear with COD, while the relationship between other wavelengths and water quality parameters is more complicated. In order not to lose useful information about water quality parameters provided by other wavelengths, the light source used in this instrument produces a spectrum of 250-470 nm. The influence of different wavelengths on the change of water quality parameters is analyzed by intelligent software to establish a relationship model between the two. And many foreign instruments use more or less chemical reagents. For example, several DKK-TOA water quality analyzers belong to this type. The instrument designed by the author does not need any chemical reagents in use, so it can obtain various water quality parameters more quickly and directly. Compared with previous water quality analyzers, this system has the advantages of fast measurement speed, good repeatability, low cost, and no secondary pollution.
2. The system hardware structure analyzer adopts a modular design. Apart from facilitating the expansion of different measurement units later, the main purpose is to prevent mutual interference between modules and improve the stability of the instrument operation.
The instrument is divided into three parts: water circulation system, sampling system, water quality analysis and display system.
The water circulation system includes a water inlet system and a water outlet system. The water inlet system continuously supplies the water sample to the analyzer. The inlet water pump and the electromagnetic valve are introduced into the sampling system under the control of the analyzer's built-in software. The effluent system will discharge the effluent from the sampling system and obtain the current effluent sample.
The sampling system includes a water quality physical and chemical parameter acquisition system and a spectral data acquisition system. The physical and chemical parameter collection system of water quality mainly includes sensors and transmitters. Sensors include general water quality parameters including pH, temperature, and conductivity. The transmitter sends it to the IPC. The spectral data acquisition system is mainly composed of a light source, an optical fiber, and a spectrometer. The light source is used to provide a stable UV laser, which is received by the spectrometer through the sewage and sent to the IPC after processing. Fiber is the transmission medium for optical signals.
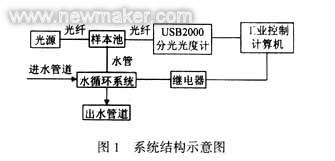
The water quality analysis and display system processes the data obtained from the sampling system and displays the final result. It mainly includes industrial control computers, A/D cards, relays, and display LCD touch screens. The IPC can complete most of the functions of the computer. In addition to the built-in intelligent analysis software, it also provides a number of expansion slots. The A/D card is used for data acquisition and control of the hardware in the water circulation system via relays. The LCD touch screen not only displays the water quality parameters, but also directly performs various operations on the analyzer. The structure of the instrument is shown in Figure 1.
3. The system software is designed as an intelligent online analysis and test system. It can not only detect water quality parameters automatically and in real time, but also can update and display historical data of water samples at any time through its own database. This is very practical for monitoring the trend of changes in water quality.
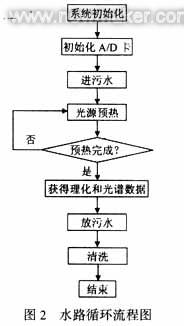
3.1 Control of water circulation system and acquisition of water quality data The software controls the water pump and solenoid valve to form a water circulation system through relays. When the measured effluent enters the sample cell, the system turns on the light source and after sufficient preheating, spectral data is obtained. Other water quality parameters are sent through the transducer through the probe in the sample cell. The data acquisition process is shown in Figure 2. The final discharge of sewage and cleaning.
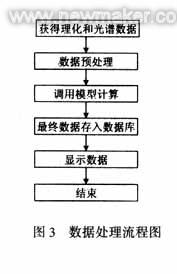
3.2 Processing and Display of Water Quality Data The spectral data and other physical and chemical parameters obtained by the software are sent to the model for analysis after preprocessing, and the results are finally displayed on the LCD screen. At the same time, the analysis data is stored in the database for display of historical trends. And water quality model updates. The data processing and storage process is shown in Figure 3.
3.3 Updating of water quality model The core technology of intelligent analysis software is to model the relationship between UV spectrum and water quality parameters. The model is not static, and if the nature of the water sample is very different, the model based on the original water sample will not predict the new water sample well. The software comes with re-modeling capabilities. The water quality model can be corrected by inputting a new water sample that has been determined by the standard to solve the problem that the model is inconsistent when the nature of the water sample varies greatly.
4. Introduction to Intelligent Analysis Model The intelligent analysis software uses a hybrid neural network model. The hybrid model consists of a polynomial model and a multilayer forward neural network. Such a structural design can guarantee the general adaptability of the mixed model to function fitting. For the determination of the number of hidden nodes and the weights of multi-layer forward networks, the training algorithm [8] used can be automatically determined according to the requirements of the fitting accuracy, and the number of hidden nodes in the forward network with the increase of the fitting precision requirements. Gradually increase until the fitting requirement is reached. Even when the fitting accuracy is too high, the algorithm can determine whether to continue to add hidden nodes based on the improvement of the fitting accuracy. Such a design can ensure that a feedforward neural network with a minimum number of hidden nodes can be generated and generation can be guaranteed. The best mixed neural network model for normalization ability. At the same time, because the training algorithm is based on the least square algorithm, it is suitable for real-time online measurement.
The training algorithm used by this hybrid model is briefly described as follows:
1) Perform coarse error elimination, data filtering, normalization, and correlation analysis on the original data, and divide the sample data set into training samples and test samples;
2) Using the least squares method to get the object linear regression model;
3) Generate sample error set;
4) The error sets of training samples and test samples are used as the training samples and test samples of the multilayer forward network respectively;
5) Use the network training algorithm based on the least square method to generate the most simplified forward neural network;
6) Combine forward neural network and polynomial model to form a hybrid neural network model.
5, the actual operation of the analysis of the online water quality parameter analyzer can be used for a variety of parameter measurement, such as COD, BOD, TOC, etc. Here only the COD value (chemical oxygen demand) test as an example to illustrate the test accuracy and effectiveness .
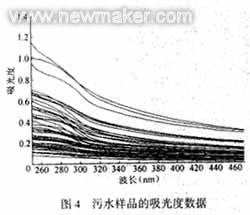
The sample data used in this paper were from 54 samples of municipal wastewater. The corresponding absorbance data were obtained using a UV spectrometer, as shown in Figure 4, and each water was obtained using the standard COD test method (potassium dichromate method) [9]. The actual COD value.
According to the processing results of the software preprocessing module, spectral absorbances (254 nm, 265 nm, and 360 nm absorbance data) of three specific wavelength bands are selected as input data from the entire waveband. In order to prevent model deviation during the modeling process, the intelligent analysis software can use the absorbance data of two or three specific spectral segments as input simultaneously and compare various modeling results to automatically determine the best feature band for predicting the best effect. Absorbance data is used as modeling input data.
Since the number of data points is small (only 54), the leave-one-test [10] is used to compare the accuracy of the estimation of each model. That is, one of the 54 sample data points is taken out in turn as test data, the remaining 53 data are used as training data, and then the test data is predicted using a training-completed model, and this is repeated 54 times to obtain an estimated value of 54 samples.
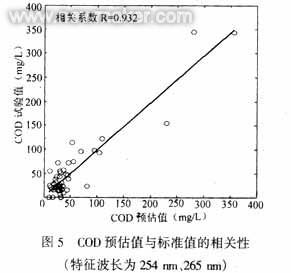
Figure 5 reflects the results of calculating the mixed model with the two characteristic wavelengths with the highest correlation coefficients (254 nm and 265 nm). The Y-axis represents the true value of the COD, the X-axis represents the predicted value of the COD calculated by the model, and the dot is the distribution of the COD sample from the true and predicted values ​​on the plot. A 45° straight line measures the predicted value of the COD from the COD. The degree of truth. As can be seen from the figure, the sample training results are distributed in the vicinity of a straight line, showing that the mixed model has good prediction accuracy.
6. Conclusions The experimental results show that the prediction model has good correlation and high analysis accuracy; the algorithm used has fast calculation speed and is suitable for online monitoring. From the actual operation point of view, the online water quality analyzer has the characteristics of high accuracy, good tracking performance, easy operation, friendly man-machine interface, and low operating cost. Its unique closed waterproof structure can adapt to any outdoor conditions and data transmission. The function is suitable for remote monitoring and can report water quality condition at any time, and has greater technical advantages compared with similar products.
OEM orders are produced according to customers' sampels or drawings.
Based on many years of rich experience in slurry pump manufacturing and
design, NAIPU can undertake OEM customization for the whole set of pump
and various spare parts. The slurry pump spare parts can be made of
various material according to customer`s requirement, Such as : Alloy
20, Hastelloy Alloy , A 61 and so on.
eg: 1. OEM larege impellers
Materi: High chrome/A05/Cr27,Rubber,Or as you request. This impeller can used in Warman 20/18GY-AHP model pumps

2. OEM E4147 U01
This impeller /E4147 is made of Polyurethane Flexurane

3. OEM Hastelloy alloy pump parts

OEM Slurry Pumps,OEM Slurry Pump Part,OEM High Chrome Slurry Pumps
Shijiazhuang Naipu Pump Co., Ltd. , https://www.naipu-pump.com